


Plating Equipments
 |
PC Monitoring System
Display equipment realistic animation
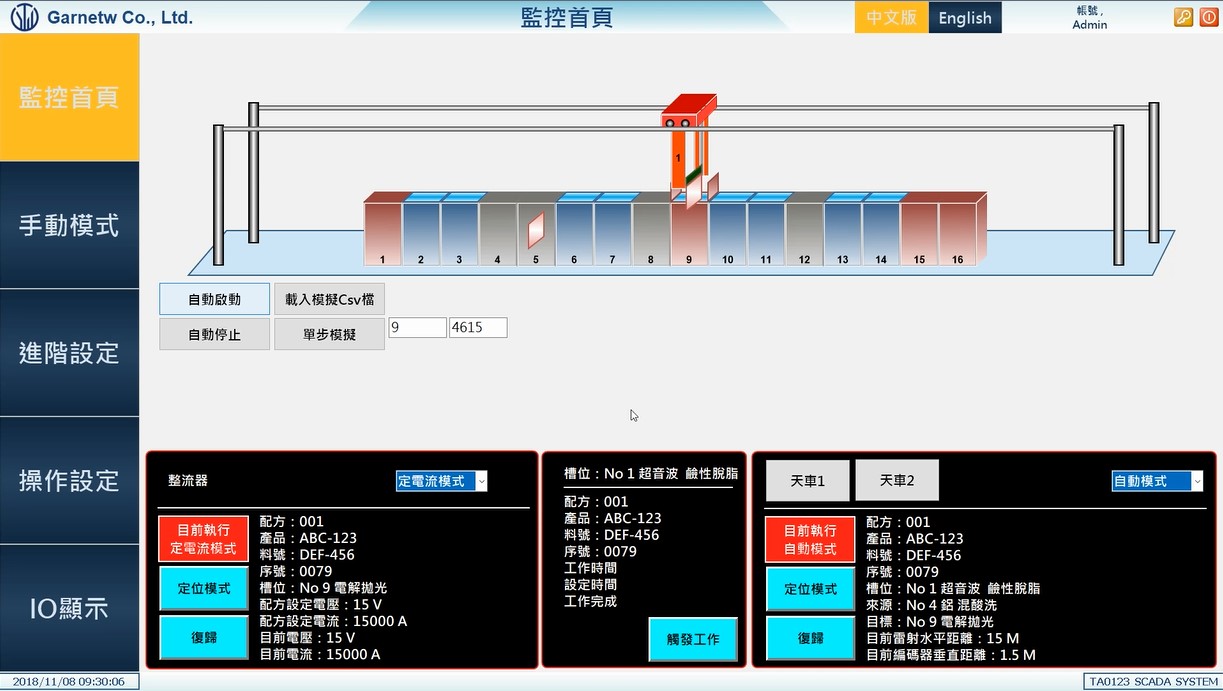
Industrial PC is installed in the offices of electroplating engineers. Through network connection, engineers can understand the operating status of the equipment via realistic animation of the equipment.
Display all real-time data in the equipment.
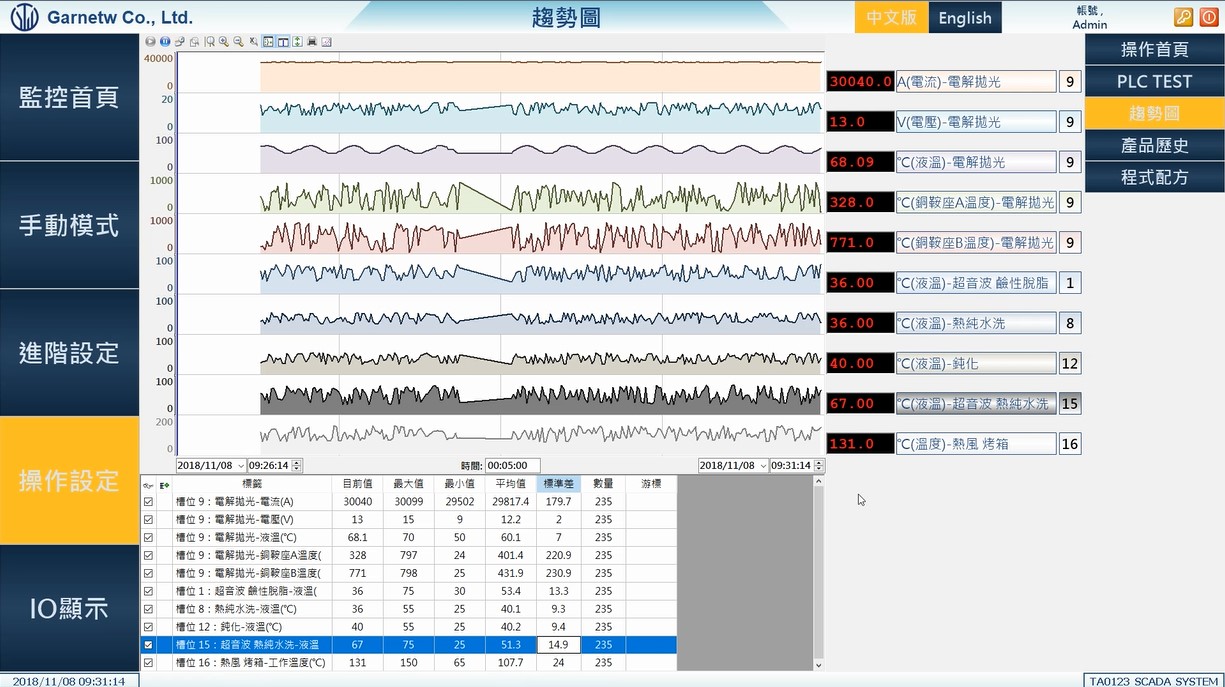
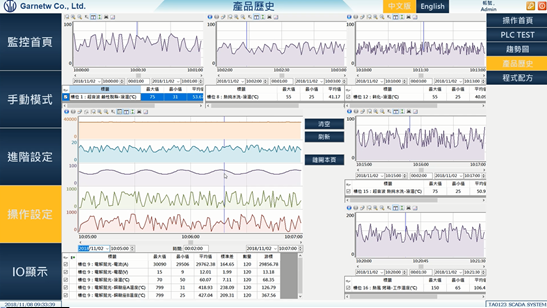
Displays all current, voltage and temperature data in the equipmemt in real time, supplemented by a trend chart of value changes within 5 minutes.
The trend chart allows you to understand the changes in values. Want quality quantitative statistics?
Industrial PCs can calculate the maximum, minimum, average, and standard deviation in real time, allowing experienced engineers to determine the quality of operation and to fine-tune equipment operating parameters accordingly.
Offers Program formula
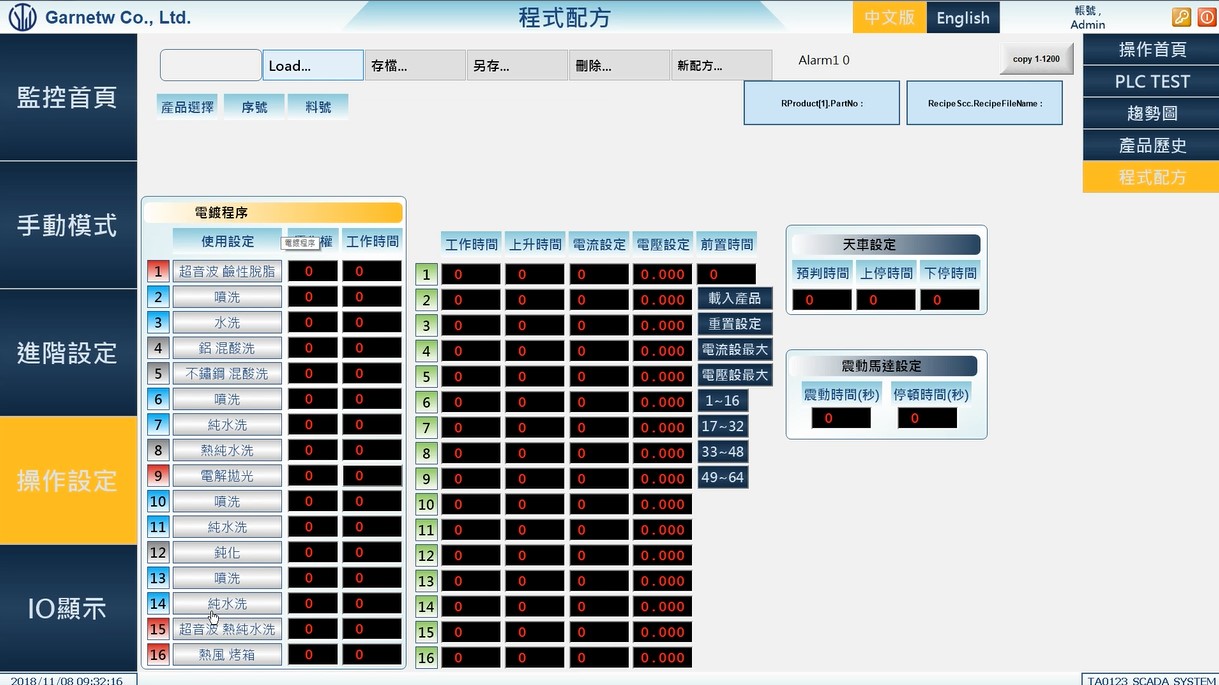
Electroplating program interface that allows users to input their own
Program interface for selecting next step tank procedures by yourself
Customize the stay time interface for each tank
Rectifier multi-stage control interface
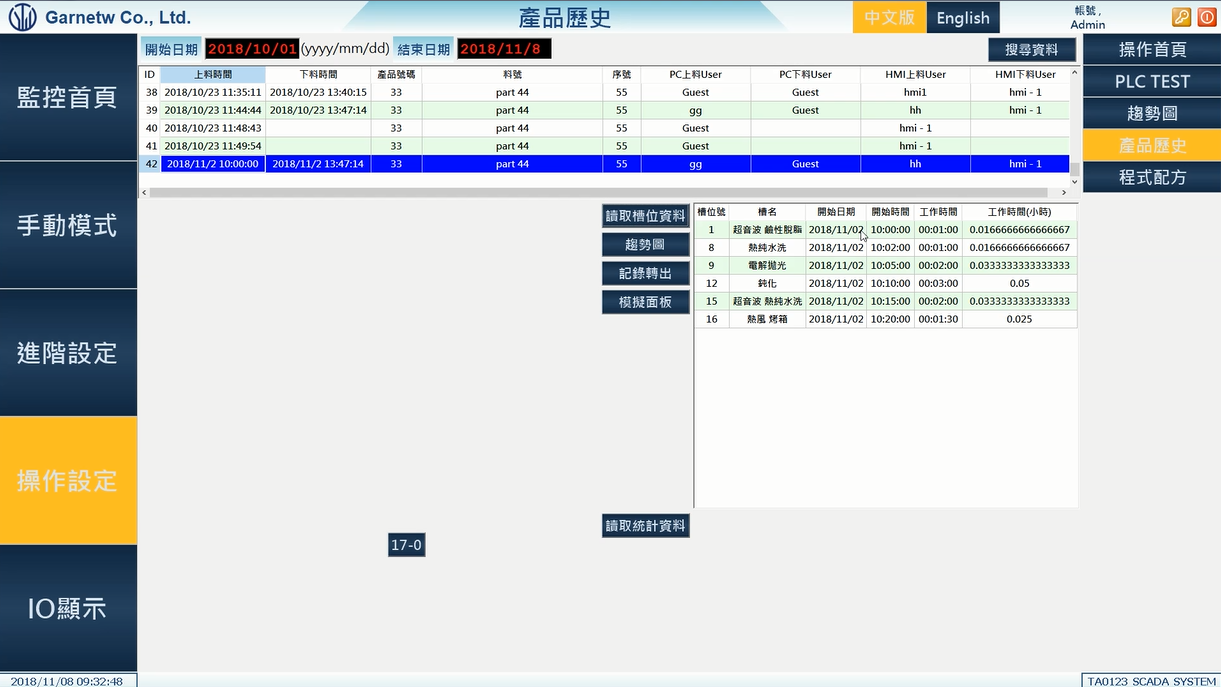
Product production history query function
Enter the start date and end date to list the products loaded during the period. Click a specific loaded product to read the entry time and working time of the product in each tank. Click the trend chart to display the chart value changes during the production of the product and provide statistical data: maximum value, minimum value, average value, standard deviation
Conclusion:
With these features, it is easier for engineers to fill out quality reports and quality control
Industrial PC is installed in the offices of electroplating engineers. Through network connection, engineers can understand the operating status of the equipment via realistic animation of the equipment.
Display all real-time data in the equipment.
Displays all current, voltage and temperature data in the equipmemt in real time, supplemented by a trend chart of value changes within 5 minutes.
The trend chart allows you to understand the changes in values. Want quality quantitative statistics?
Industrial PCs can calculate the maximum, minimum, average, and standard deviation in real time, allowing experienced engineers to determine the quality of operation and to fine-tune equipment operating parameters accordingly.
Offers Program formula
Electroplating program interface that allows users to input their own
Program interface for selecting next step tank procedures by yourself
Customize the stay time interface for each tank
Rectifier multi-stage control interface
Product production history query function
Enter the start date and end date to list the products loaded during the period. Click a specific loaded product to read the entry time and working time of the product in each tank. Click the trend chart to display the chart value changes during the production of the product and provide statistical data: maximum value, minimum value, average value, standard deviation
Conclusion:
With these features, it is easier for engineers to fill out quality reports and quality control
![]()
